Implied Volatility
Implied Volatility (IV) is the volatility computed from the market prices of options. The buyers and sellers of options consider the future volatility of the underlying stock while pricing their trades. For example, the seller of an 3-month option on Microsoft stock guesses the volatility of the stock for the next three months, and based on that guess and other variables decides on a price to trade. Similarly, the buyer of the same option might have a guess of his own. If the options market has good liquidity, we can say that the bid and ask prices of the options contains and represents the aggregate guess of the traders about the volatility for a future period. In otherwords, the market prices of a 3-month option contains the aggregate guess of the traders about the volatility of the underlying stock for the next three months. Similarly, the market prices of a 6-month option contains the aggregate guess of the traders about the volatility of the underlying stock for the next six months, and so on. Therefore, it is possible for us to extract the volatility from these market prices. The volatility so extracted is forward looking in nature and is the consensus volatility of all traders in that market for a future time period and is therefore better than the historical volatility, which is backward looking in nature.
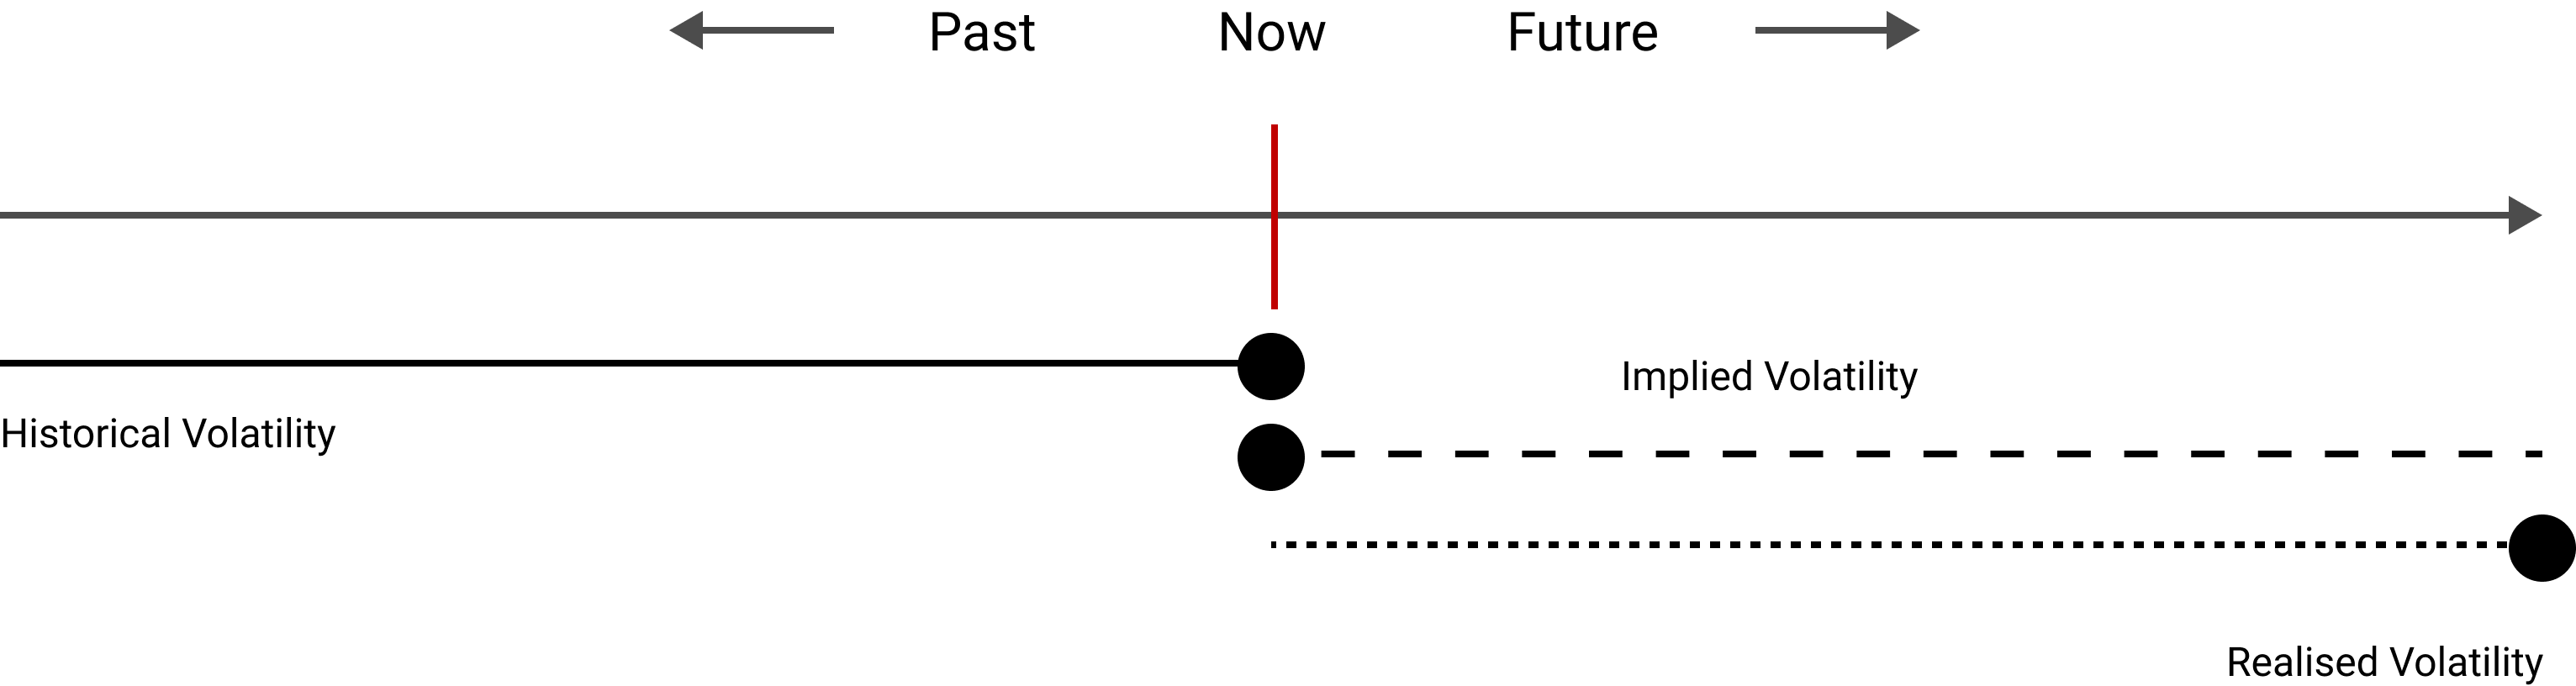
There is no analytical formula to compute the implied volatility. However, we can use the Black-Scholes equation to extract the volatility from the market prices, using trial-and-error methods. The below diagram shows the forward looking nature of the implied volatility.
Types of Implied Volatility
Implied Volatility can be calculated from prices of call options, put options and/or both. The terms "Implied Volatility (Calls)", "Implied Volatility (Puts)", and "Implied Volatility (Mean)" are used to denote these types.The implied volatility (calls) is derived from pricing of "at-the-money" call options. The implied volatility (puts) is derived from pricing of "at-the-money" put options. The implied volatility (mean) is derived from the average of the call and put implied volatilities.
Historical vs Implied volatility - How much do they differ?
It depends on the underlying stock, liquidity and other factors. For highly liquid stocks, the difference could be less; for illiquid stocks, the difference can be significant. For example, the following table shows the historical and implied volatilities for some stocks as on 16th October 2020.| Sl No | Stock Name | HV for 30 days | IV (Mean) for 30 days | Remarks |
|---|---|---|---|---|
| 1 | Microsoft | 28.31% | 34.83% | The difference is less |
| 2 | 28.06% | 37.84% | ||
| 3 | Tesla | 66.16% | 76.97% | |
| 4 | Bank of America | 33.19% | 32.58% | |
| 5 | Boeing | 52.59% | 55.39% | |
| 6 | Zymeworks Inc. | 45.89% | 77.87% | The diference is more |
| 7 | ZioPharm Oncology Inc. | 51.67% | 126.32% | |
| 8 | XPEL, Inc. | 65.75% | 90.14% |
Note: HV stands for Historical Volatility and IV stands for Implied Volatility.